|
Custom design and manufacture of state-of-the-art battery
chargers, UPS, battery packs and power supplies for OEMs in a Hurry
Do you want 40 amps from an 81 gram, 1.2 volt cell?
Ours do 98
amps!
Do you want to charge
fast?
How About 15
minutes?
 (latest tests show no degradation in performance
and only slight temperature rise at a charge rate of 4 C. Further tests continue.)
(latest tests show no degradation in performance
and only slight temperature rise at a charge rate of 4 C. Further tests continue.)
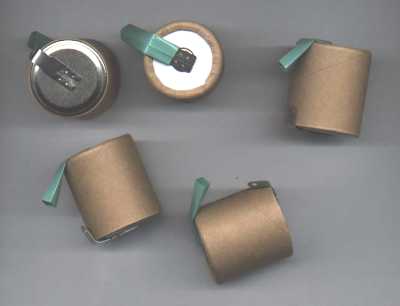
We have asked our
factory to develop a custom-engineered ½ D cell for high current capability specifically
for the battle robot industry. These are nominally 2.5 AH capacity.
We were getting 98
amp pulses before all the MOSFETs in our constant current load blew out. Unfortunately this
data wasn't logged.
| Current |
Discharge
Rate |
Capacity
(amp
Hours) |
Percentage of
Nominal
AH |
Conditions |
| 2 Amps |
C/1.25 |
2.47 |
100% |
Continuous |
| 10 Amps |
4C |
2.45 |
99% |
Continuous |
| 20 Amps |
8C |
2.15 |
87% |
Continuous |
| 30 Amps |
12C |
2.40 |
97% |
Pulsed |
| 40 Amps |
16C |
2.37 |
96% |
Pulsed |
| 50 Amps |
20C |
2.35 |
95% |
Pulsed |
| 60 Amps |
24C |
2.16 |
87% |
Pulsed |
| 70 Amps |
28C |
2.00 |
81% |
Pulsed |
This is the significant data. As
you can see, even at high currents the battery retains a significant proportion of its nominal
capacity. Pulsed means 2 seconds on, 8 seconds off. We did the measurement this way because we
didn't want to damage our constant current load.
Note that even though the
capacity in Amp Hours is maintained, the cell voltage is not. The following curves give the
data. The data below were taken from the same 10 cell pack, charged at about C/3. Cells were
allowed to cool before charging.
This curve is a C/1.25 rate, and
still has 100% of the rated capacity.
The 10 Amp, or 2.5C discharge curve, showing
99% of rated capacity..
This curve shows an 8C discharge
rate. Capacity to 0.9 volt per cell is 87% of rated.
This curve shows the discharge
and voltage swings under 30 amp pulses. The duty cycle is 20%, consisting of 2 seconds on and 8
seconds off. As can be seen, the voltage swings are about 0.2 Volts per cell for most of the
discharge, but towards the end of the test the voltage drop increases. At a bottom voltage of 6
volts the test was cut off because the temperature rise changed slope, indicating that
something new was happening. There are 129 pulses above 9 volts, and 142 pulses above 6
volts.
This is the first 5 pulses of the
30 amp pulse test, showing the shape of the pulse and the recovery level.
This curve repeats the pulsed
data for 40 amp discharge. In this case the voltage sag starts off to be about 0.3 volts per
cell. There are 78 pulses above 9 Volts and 105 pulses above 6 volts.
The first 6 pulses of the 40 amp
pulse test. 
At 50 amps per pulse the voltage sags about 0.4 volts per
cell. There are 44 pulses above 9 volts, and 83 pulses above 6 volts.
The first 5 pulses of the 50 amp test.
The first 5 pulses of the 60 amp pulse
test.
The 70 Amp pulse test shows a swing of about 0.5 volts per cell. There are 51
pulses above 6 volts.
The first 5 pulses of the 70 amp pulse
test.
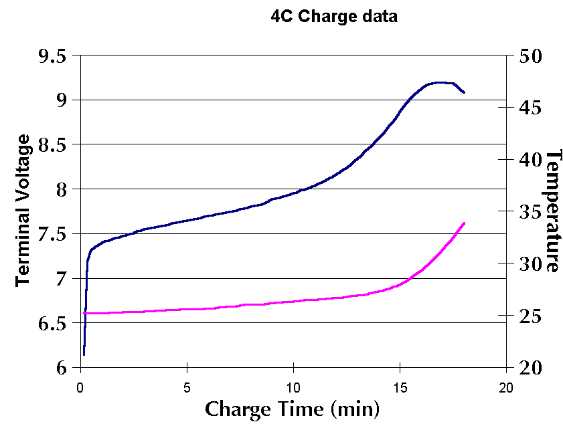
Charging at a 4 C rate works very well. There are
some subtleties about terminating when charging at this rate, so contact us for more
information. Charging at higher rates should be possible. The charge terminates at 18 minutes,
with the final cell temperature at about 93 °F.
For a chart of
the sizes and weights of cylindrical batteries click here:
For more battery engineering
resources click here:
Note: We don't inflate
our specifications as many companies do. The capacity in amp-hours is guaranteed, and will be
exceeded most of the time. "Usable cycles" is unknown under these abusive
conditions |